Vermont publishes daily updated Covid-19 data via API. I used that data to do some hands-on learning with Jupyter Notebooks, Pandas dataframes, Matplotlib, and some simple Python to create my own Covid-tracking charts. See the repository at vt-covid-jupyter-charts for details.
I'm fortunate to live in a state that has been relatively less impacted by Covid-19 than many other places. Still, we've followed protocols to keep ourselves and our community safe, while trying to keep tabs on the progress of the pandemic.
Vermont has done a good job providing public access to a variety of daily Covid-19 statistics through the Vermont Open Geodata Portal, including:
VT COVID-19 Daily Counts VT COVID-19 Hospitalizations by Date VT COVID-19 Cases by County Time Series
There are a few others, but these provide the most useful time series data, updated daily, with the latest data available in GeoJSON format via API.
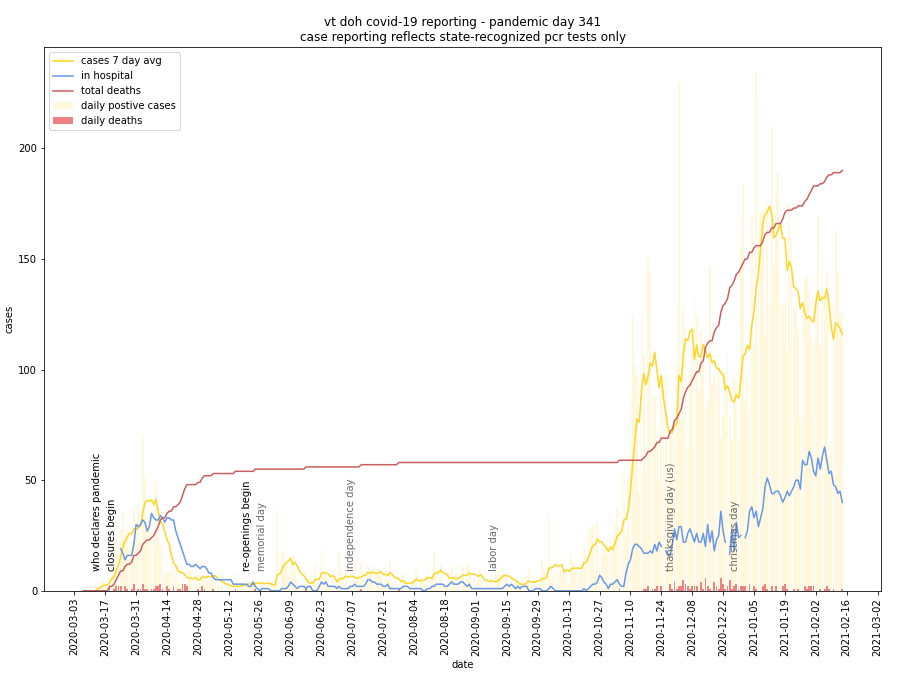
That said, I was less thrilled by the Vermont Department of Health Covid-19 Dashboard, which focuses too heavily on daily counts and overall totals.
Daily counts are hard to intuit into trends. 2, 5, 8, 3 sounds like not a lot. But those numbers add up. What I wanted to see was trends — how those small numbers added up over time.
I also knew that those two new cases stayed sick — or at least contagious — for some time after a positive test, and those "estimated current cases" add up.
Knowing the data was available via API in JSON format, I chose to parse the data and create my own chart. I had recently edited Glenn Prince's Data Cleaning with Python and Pandas article series, which inspired me to try out Jupyter Notebooks and Pandas for this project. The built-in Matplotlib charting functions were fine for my use so I did not explore any specialized charting libraries.
I highly recommend Glenn's tutorials for an introduction to Jupyter and Pandas Dataframes. It's very intuitive and easy to manipulate data once you wrap your head around these tools.
Charting turned out to be slightly more complicated — mostly because I insisted on employing a few edge-case configuration options that were not well documented. I made notes about these options in my notebooks.
There are two notebooks:
- VT-Covid-19-ByCounty.ipynb - county-by-county test and hospitalization data
- VT-Covid-19-Data-Pandas.ipynb - full-state data including tests, hospitalizations, and deaths
The source is available in a repository at vt-covid-jupyter-charts if you want to experiment.